
Football statistics websites have transformed the way fans watch the game. Instead of simply checking the final score, supporters can now explore possession percentages, expected goals (xG), passing networks, sprint speeds, heat maps, and hundreds of other metrics within seconds of an event happening.
But have you ever wondered how these websites collect and process such enormous amounts of information so quickly? Behind every live statistics page is a sophisticated combination of cameras, data collection systems, artificial intelligence, cloud computing, and powerful databases working together in real time.
This guide takes you behind the scenes to explain the technology powering today’s biggest football statistics platforms.
How Football Data Is Collected
Everything begins inside the stadium.
Professional matches are monitored by multiple high-definition cameras positioned around the pitch. These cameras continuously track the movement of every player, the referee, and the ball throughout the game.
At the same time, trained data analysts record every important event, including:
- Passes
- Shots
- Tackles
- Fouls
- Corners
- Offside decisions
- Clearances
- Saves
- Crosses
- Dribbles
Every action receives a precise timestamp, allowing statistics websites to recreate the match almost instantly.

Optical Tracking Technology
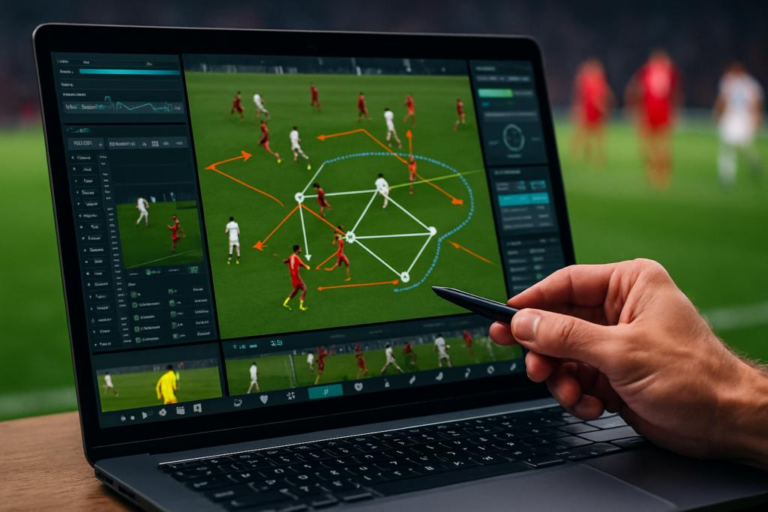
One of the biggest innovations in football analytics is optical tracking.
Rather than relying solely on human observers, advanced computer vision systems automatically identify every player on the pitch.
The software tracks:
| Data Captured | Why It Matters |
|---|---|
| Player Position | Tactical analysis |
| Running Distance | Fitness monitoring |
| Sprint Speed | Physical performance |
| Ball Location | Build-up analysis |
| Defensive Shape | Team organization |
| Player Spacing | Tactical structure |
Modern systems can track players dozens of times every second, creating millions of data points during a single match.
Event Data vs Tracking Data

Football statistics websites generally combine two different types of information.
Event Data
This records what happened.
Examples include:
- Goals
- Assists
- Passes
- Tackles
- Yellow cards
- Corners
- Saves
Tracking Data
This records where everything happened.
Tracking data includes:
- Player movement
- Ball movement
- Speed
- Distance covered
- Positioning
- Pressing intensity
When these two data sources are combined, analysts can explain not only what happened but also why it happened.
Artificial Intelligence in Football Analytics


Artificial intelligence has become one of the most important tools in modern football data analysis.
AI systems can automatically identify patterns that would take humans hours to discover.
Some examples include:
- Detecting pressing systems
- Measuring defensive compactness
- Identifying dangerous attacking zones
- Predicting passing options
- Calculating scoring probabilities
- Recognizing tactical formations
Instead of manually reviewing an entire 90-minute match, AI can process thousands of events within minutes.
How Live Statistics Update So Quickly

Fans often notice that statistics refresh only seconds after an event occurs.
This happens because modern football data systems operate through live data pipelines.
The typical process looks like this:
- A match event occurs.
- Cameras and analysts detect the event.
- Validation software checks the information.
- Central servers process the data.
- Cloud infrastructure distributes updates worldwide.
- Websites and mobile apps instantly display the new statistics.
The entire process usually takes only a few seconds.
The Role of Cloud Computing
A major international match can attract millions of users simultaneously.
Without cloud technology, football statistics websites would struggle to handle the enormous traffic.
Cloud servers help by:
- Storing massive databases
- Scaling during major tournaments
- Delivering fast global access
- Reducing downtime
- Backing up historical match data
This allows fans around the world to receive updates almost instantly, regardless of their location.
How Heat Maps Are Created
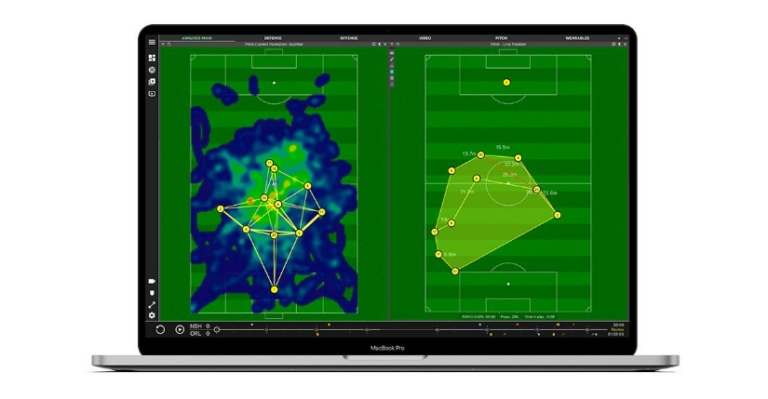
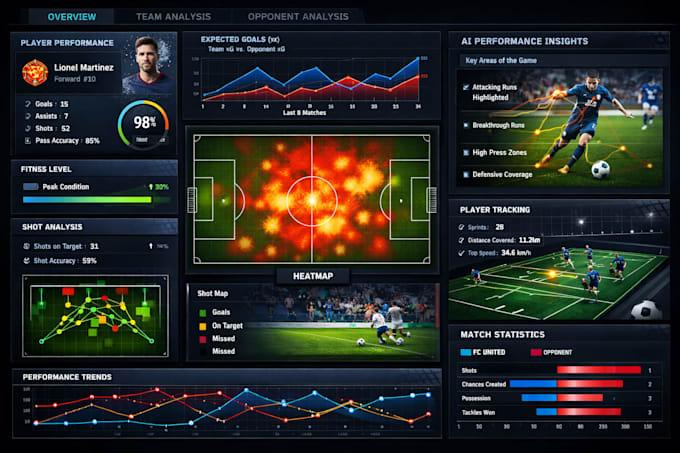
Heat maps are among the most recognizable football analytics tools.
Every time a player moves, their location is recorded. Over thousands of position updates, software builds a visual representation showing where that player spent most of the match.
Heat maps help reveal:
- Defensive positioning
- Attacking runs
- Areas of influence
- Tactical roles
- Changes in formation
Coaches often use these visuals to evaluate performances and adjust their game plans.
Calculating Advanced Football Metrics
Modern statistics websites go far beyond goals and assists.


Advanced metrics include:
| Metric | What It Measures |
|---|---|
| Expected Goals (xG) | Chance quality |
| Expected Assists (xA) | Pass quality leading to shots |
| Progressive Passes | Forward ball progression |
| Progressive Carries | Ball movement toward goal |
| Pressures | Defensive pressure actions |
| Pass Completion | Passing accuracy |
| Shot-Creating Actions | Build-up before shots |
These statistics give fans and analysts a deeper understanding of player and team performance.
Why Accuracy Matters
Football statistics influence much more than fan discussions.
Professional clubs use detailed analytics for:
- Scouting new players
- Tactical preparation
- Injury prevention
- Opposition analysis
- Player recruitment
- Contract evaluations
Even broadcasters rely on live statistics to enhance match coverage and provide viewers with meaningful insights.
Because these numbers affect important decisions, data providers invest heavily in quality control, combining automated systems with human verification to maintain high levels of accuracy.
The Future of Football Statistics
Technology continues to reshape football analytics.
In the coming years, fans can expect:
- Faster live updates
- More detailed player tracking
- AI-generated tactical insights
- Improved predictive analytics
- Enhanced 3D match visualizations
- Personalized statistics based on individual interests
As data collection becomes even more sophisticated, football statistics will offer an increasingly complete picture of every match.
Final Thoughts
Football statistics websites are powered by an impressive blend of cameras, human expertise, artificial intelligence, cloud computing, and advanced analytics.
Every pass, sprint, tackle, and shot is captured, processed, and transformed into insights that help fans, coaches, analysts, and clubs understand the game on a much deeper level.
The next time you refresh a live match page and see updated numbers appear within seconds, you’ll know that an entire network of cutting-edge technology is working behind the scenes to make it happen. ⚽📊